
A Look Into the Markets - April 10, 2026
Markets found support as tensions between the U.S., Iran and Israel showed signs of de-escalation. While far from resolved, the reduced threat of immediate conflict helped calm global markets.
The biggest reaction showed up in energy. Oil prices dropped nearly $25 per barrel from recent highs. That matters. Lower oil reduces inflation pressure, which in turn supports bond prices and helps bring interest rates down.
Fed’s Favorite Inflation Gauge
Core PCE, the Fed’s preferred measure of inflation, came in at 3.0 percent year-over-year; still well above the Fed’s 2.0 percent target.
Progress? Yes. Mission accomplished? Not yet. A key driver remains healthcare costs, which continue to run hot and keep core inflation sticky. This is exactly the type of data that keeps the Fed cautious and limits how quickly rates can fall.
The Range Holds at 4.3 Percent
Since peaking at 4.48 percent on March 27, the 10-year Treasury yield has improved and is now hovering near 4.3 percent.
We remain range-bound: 4.2 percent = support (floor); 4.5 percent = resistance (ceiling). Until we break out of this range, expect mortgage rates to move within a relatively tight band.
| 30-year Mortgage Rates |
|
|||||
| 10-year Treasury Note Yields |
|
Looking Ahead: Data and Fed Timing
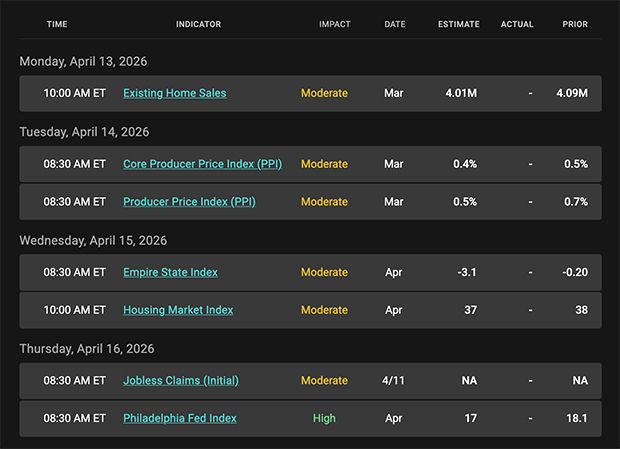
This week brings several key reports that could shape rate direction:
PPI (Producer Price Index): A read on pipeline inflation; does it confirm cooling trends or signal lingering pressure?
Housing data: A direct look at how consumers are responding to current rate levels.
Manufacturing data: A pulse check on economic momentum; any softness could help bonds. The opposite is true.
Earnings season begins: Watch corporate guidance closely for insight into economic expectations and sales guidance.
The Fed quiet period begins April 18, limiting commentary, with the next Fed meeting set for April 28–29. Markets will begin positioning ahead of that decision. This is slated to be Jerome Powell’s final meeting as Fed Chair.
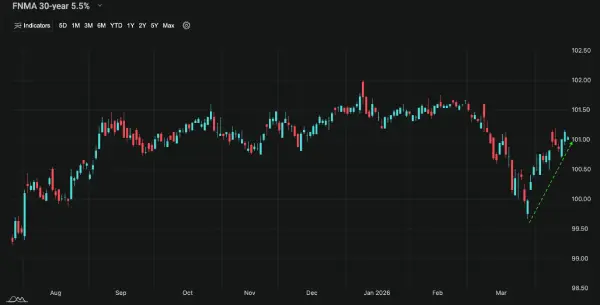
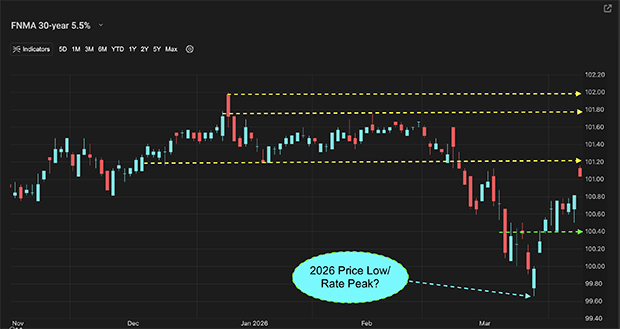
Mortgage Market Guide Candlestick Chart
Each candle represents one day of trading. As mortgage bond prices move higher, rates move lower. On the right side of the chart, you can see prices have bounced nicely off the 2026 lows (which corresponded to the highs in rates) and have recouped more than half of the recent losses.
Chart: Fannie Mae 30-year 5 percent coupon (Friday, April 10, 2026)
Economic Calendar for the Week of April 13-17
|


Recent Posts