
Rates & Market
Mortgage Rates Hit 7.40%, a Nearly Three-Year High
By Tim Penner · Penner Group Properties · October 13, 2026
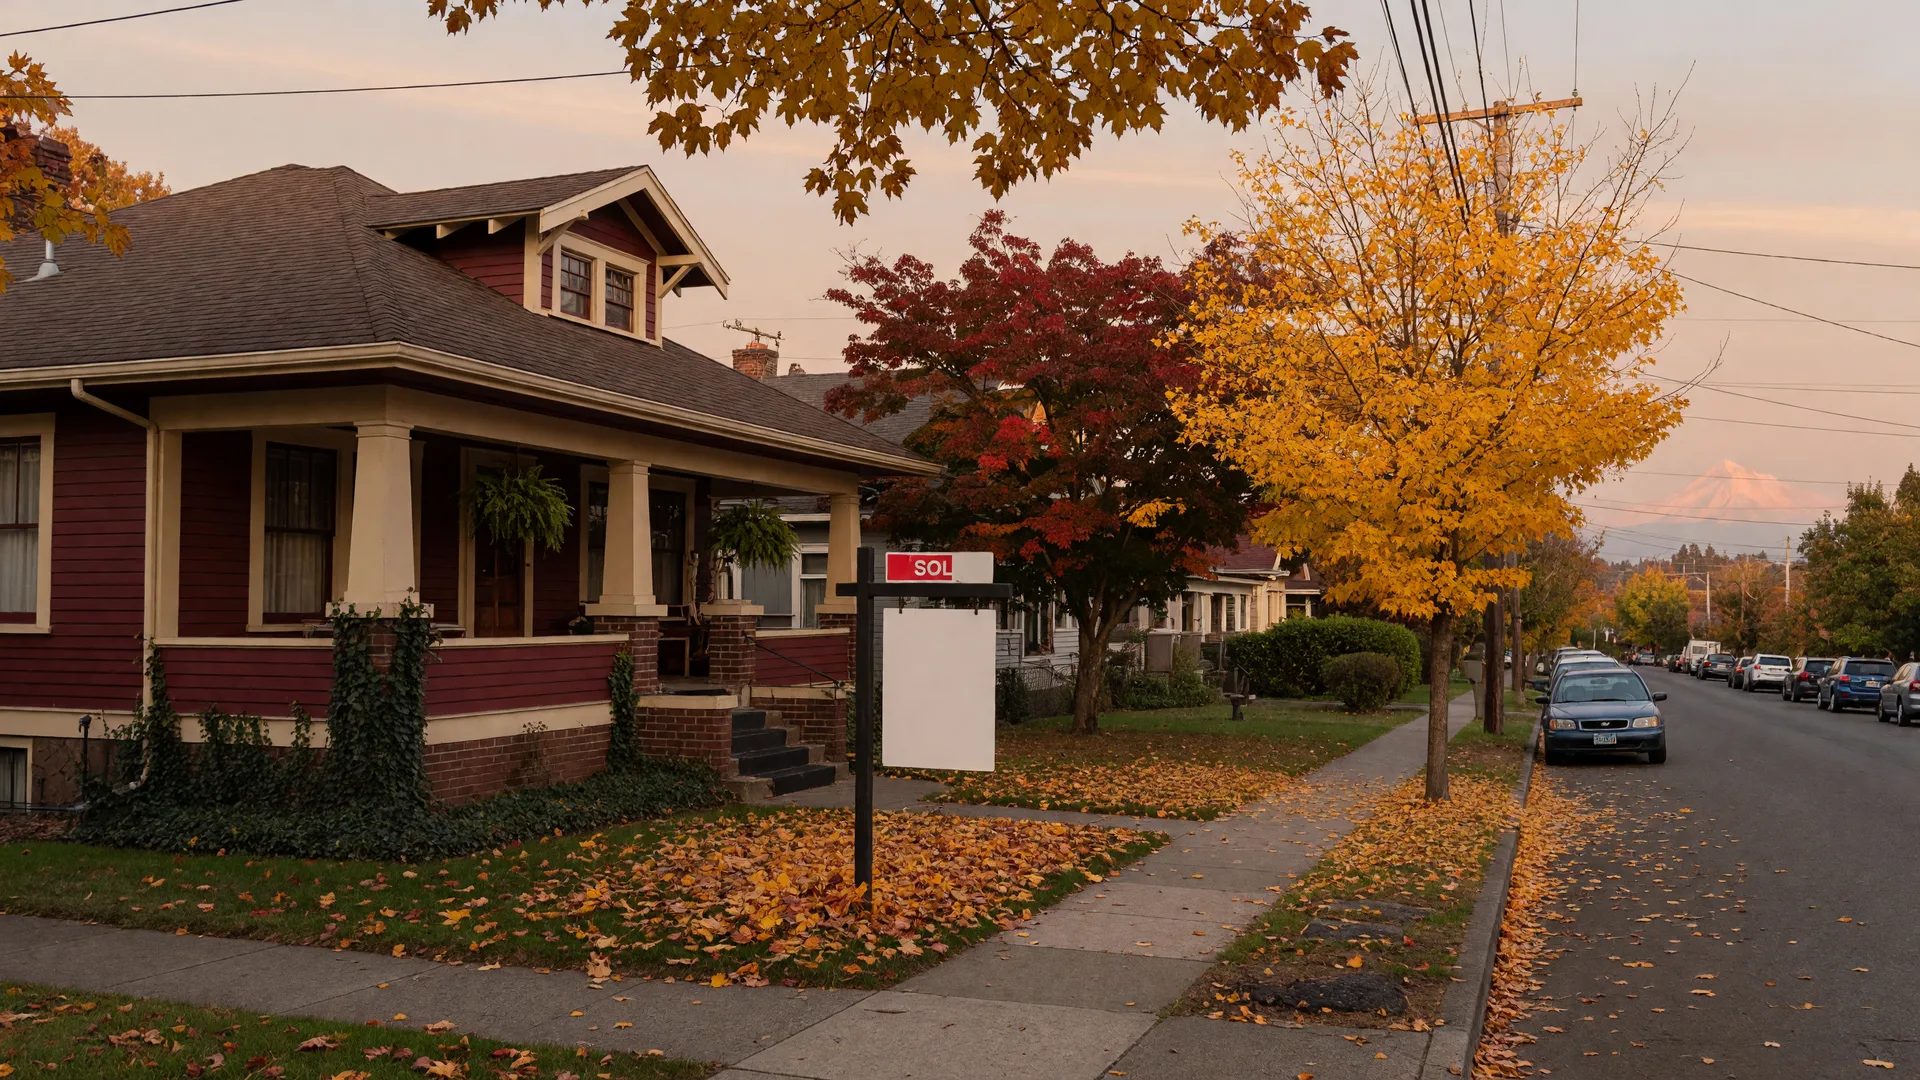
Rates at a Nearly Three-Year High · Greater Portland, Oregon
The Short Version
Freddie Mac's weekly survey put the average 30-year fixed mortgage at 7.40% for the week of October 8, 2026, up from 7.28% the week before and the highest reading since November 16, 2023, after seven straight weekly increases. The 15-year fixed averaged 6.73%, and the benchmark 10-year Treasury closed at 5.22% on October 8 as a global bond selloff kept pushing financing costs up. On a median-priced Portland metro home, that adds roughly $35 a month to the payment compared with the prior week, about $110 more than early September, and about $315 more than a year ago. The Federal Reserve meets again October 27-28, and unlike earlier this fall, markets now expect it to hold rates, with fed funds futures pricing roughly an 80% probability of no change. Higher rates are cooling demand, not collapsing it: the metro's September data show a buyer-friendly market with price reductions on roughly a third of listings, near-peak inventory, and a median sale price of $540,000 on the latest full RMLS report. This note walks through why rates keep climbing, what it does to the monthly math, and how buyers and sellers across our service areas can respond.
7.40%
Average 30-year fixed mortgage, week of October 8, 2026
Freddie Mac PMMS, up from 7.28%; the highest since November 16, 2023
6.73%
Average 15-year fixed mortgage, same week
Up from 6.60% the week before
5.22%
10-year Treasury yield, October 8
FRED DGS10; the benchmark mortgage rates track
~$35
Extra monthly payment on a $432,000 30-year fixed loan
Versus the prior week; illustrative math, not a quote
Rate and yield indicators as of the week of October 8, 2026. The monthly-payment figure is illustrative math on a 30-year fixed loan, not a quote. Sources are listed at the bottom of this page.
Why Rates Keep Climbing
Mortgage rates do not follow the Federal Reserve directly; 30-year fixed loans track long-term bond yields, and those yields have been climbing for seven straight weeks. A global bond selloff, fed by persistent inflation concerns, high fuel and oil prices, and heavy government borrowing, pushed the benchmark 10-year Treasury to close at 5.22% on October 8, after touching its highest levels in more than two decades in early October. Freddie Mac's survey followed the market up, and the AP described the reading as the highest in nearly three years, the seventh consecutive weekly increase.
The Federal Reserve set the stage for part of this. Its September 16 decision, the first hike since 2023, took its target range to 3.75% to 4.00%. The next decision comes at its October 27-28 meeting, with the announcement on October 28, and the outlook has shifted since our last rate note: fed funds futures now price roughly an 80% probability that the Fed holds rates steady, with only about a 20% chance of another quarter-point hike, and essentially no chance of a cut. The final scheduled meeting of 2026 is December 8-9. A year ago, the average 30-year fixed mortgage was 6.30%, which is why today's reading feels like a different world. The practical point for homebuyers is the same one we have made all year: the Fed sets the short-term rate, markets set your mortgage, and the two do not move in lockstep. What matters for your purchase is your own rate quote, your own payment math, and what is actually for sale in the community you want. Our earlier notes on rates at 7.28%, rates above 7%, and the Fed's September hike cover the full arc of this fall's move.
What It Means for Buyers
The honest math: on a $540,000 home with 20% down, the loan is $432,000. At 7.40%, principal and interest run about $2,990 a month. At 7.28%, the prior week's average, it was about $2,955, at 7.03% in late September it was about $2,880, and a year ago at 6.30% it was about $2,675. Taxes, insurance, and any HOA dues sit on top. The gap is meaningful, roughly $35 a month since last week and about $315 a month since last autumn, but it rarely decides alone whether a purchase works.
- Run the payment, not the headline. On a median-priced $540,000 home with 20% down, the loan is about $432,000. At 7.40%, principal and interest land near $2,990 a month, roughly $35 more than the week before, about $110 more than early September, and about $315 more than a year ago, when the 30-year averaged 6.30%. That is real money, but it rarely decides alone whether a purchase works. What decides is the full monthly number against your income, your other debts, and your plan for the next few years.
- Lock when the number works, not when the news feels right. Rates have now risen seven straight weeks, and waiting through a rising market has not rewarded buyers in 2026. If the payment at a quoted rate fits your budget, a rate lock removes the uncertainty while you tour and negotiate.
- Ask about the tools. Temporary rate buydowns, seller-paid concessions toward your closing costs or points, and adjustable-rate products with longer fixed terms all exist for a reason, and in a market where a third of listings carry price reductions, sellers often contribute. Oregon Bond and OHCS down payment assistance can also offset a higher-rate world, since they lower the price you pay for the money you borrow.
- A higher rate can be a negotiating lever. Sellers know their buyer pool is rate-sensitive right now, and the September data show price reductions are already common across the metro. Price is not the only thing that moves in a conversation; so do seller contributions, a quicker close, and repairs. Use the rate environment as a reason to talk, not a reason to walk away from a home that fits.
If a lower cash hurdle helps, our note on Oregon down payment assistance walks through up to $60,000 of state help, and the home buyer's guide covers the full process from pre-approval to keys.
What It Means for Sellers
- Price against the financing your buyers actually face. A buyer who qualified at 6.30% a year ago now carries roughly $315 more per month on the same loan at 7.40%. Homes priced against current, closed comparables still draw showings in the first two weeks; homes priced a year ago sit, and the September data show they are getting price cuts.
- Seller concessions are back on the table. Contributing to a temporary buydown or paying a share of closing costs can turn a rate-shocked buyer into a contract, often for less than a price cut and with more value per dollar.
- Days on market still matter. The metro's August report showed homes averaging roughly 57 days on market, and a listing that lingers gets read as stale. A sharp first-week pricing strategy keeps you ahead of that cycle.
- Presentation separates listings. In a market where buyers have choices, the home that shows at its best, clean, staged, photographed well, and marketed with intent is the one that sells on its timeline.
For a fuller picture of how a two-broker team markets a home in exactly this kind of market, our note on selling with a boutique team covers presentation, pricing, and the quiet paperwork that protects you.
What the September Market Data Show
The full RMLS September report lands mid-month, but the early reads are consistent: this is a buyer-friendlier market than the metro has seen in years, and rates are the reason.
- Price reductions are the headline. Realtor.com's September Housing Report found 31.6% of Portland metro listings carried a price reduction in September, the third-highest share among the 50 largest U.S. metros, behind only Salt Lake City at 33.6% and Denver at 32.1%, and well above the 20.8% national average. An RMLS-based tracker that reads the market differently put the share of active listings with price decreases near 47%, still high but below the 2025 peak of 51.6%. Either way, the message is the same: pricing has become the single most important decision a seller makes.
- Inventory is near its seasonal peak. RMLS-based commentary described active listing inventory as tapering near its seasonal high in September rather than surging, and realtor.com data showed the metro's active count up roughly 7% year over year with a median listing price near $588,000, down about 2%. Buyers have more choices and more time than they have had in years.
- Sales are slower, not stopped. One Portland brokerage's monthly report counted metro closed sales down 10.7% year over year in September, and the metro's August report, the latest full RMLS release, showed a median sale price of $540,000, down 1.8% year over year, with 3.8 months of supply and about 57 days of average market time. That is a balanced, rate-sensitive market, not a falling one.
- The rate math is the engine behind all of it. On the $432,000 loan this note uses, the payment has climbed from about $2,880 at 7.03% in late September to about $2,990 at 7.40% today. Each weekly jump shrinks the pool of buyers who qualify, which is exactly why sellers who price against today's financing, not last year's, keep winning the first two weeks.
Our October 2026 market update carries the full August numbers, and it has been revised to track the rate climb since it first ran.
What This Looks Like in Our Service Areas
A rate near a three-year high lands differently at different price points, which is why local knowledge matters more, not less, in a rate-sensitive market.
Beaverton, Sherwood, Wilsonville
Higher-priced corners of Washington County and the I-5 corridor carry larger loans, so the same rate shifts the payment more and rate locks matter. Condos and attached homes keep an entry point that full-size houses no longer offer in these towns, like our Sherwood condo at Woodhaven Crossing, listed at $259,000, and our Beaverton attached home at $369,000.
Hillsboro, Cornelius, Forest Grove
The technology corridor keeps both incomes and buyer demand steady, and new construction in west Washington County frequently comes with lender incentives or builder buydowns that directly answer the rate environment. Asking what incentives are attached to a new home is standard practice right now. Our two Hillsboro condos, at $349,000 and $229,000, show the entry points still available close to the MAX lines.
Newberg and Woodburn
Down the valley, lower medians mean the same rate produces a smaller monthly swing, which is part of why Woodburn keeps drawing first-time and move-up buyers. Yamhill and Marion County markets run on their own economics, and watching closed sales near a target home beats reading metro averages.
The full map of our service areas shows the range we cover, from the metro core to the Willamette Valley, and our current listings show what is actually on the market right now, priced for this rate environment.
How to Use This Fall
- Get your numbers fresh, not borrowed. Rates and lender programs change weekly; have a lender run your exact scenario with today's pricing, including points, so you are deciding on your payment, not a headline.
- Expect the market to behave like a market. Near-peak inventory and price reductions on roughly a third of listings mean inspections, financing contingencies, and negotiation are back. Use the time you have, but stay ready to act when the right home lists.
- For sellers, price for now. A first-week pricing strategy against current comparables is the single most reliable way to sell on your timeline, and seller concessions can do more work than a price cut.
- Remember the longer view. Rates at a nearly three-year high are striking, but they are not an impossible market, and the buying versus renting comparison shows why ownership still builds wealth for most households over five to ten years, even at today's rates.
Sources
The figures in this note come from these public sources, retrieved October 13, 2026:
- Freddie Mac: Mortgage Rates Average 7.40% (October 8, 2026)
Freddie Mac's Primary Mortgage Market Survey for the week of October 8, 2026: 30-year fixed at 7.40%, up from 7.28%, the highest since November 16, 2023; 15-year fixed at 6.73%, up from 6.60%. A year earlier the 30-year averaged 6.30%. Retrieved October 13, 2026.
- Freddie Mac Primary Mortgage Market Survey archive
Weekly national average mortgage rates and archive, retrieved October 13, 2026.
- AP: Average long-term U.S. mortgage rate at highest in nearly 3 years
Coverage of the October 8, 2026 Freddie Mac reading, the seventh straight weekly increase and the highest since November 2023. Retrieved October 13, 2026.
- FRED: Market Yield on US Treasury Securities at 10-Year Constant Maturity
Daily 10-year Treasury yield series: 5.22% on October 8, 2026, about 5.24% the next day. Retrieved October 13, 2026.
- Realtor.com September Housing Report: Price cuts reach yearly high
Published September 30, 2026: 31.6% of Portland metro listings carried a price reduction in September, the third-highest share among the 50 largest metros, versus 20.8% nationally. Retrieved October 13, 2026.
- Living Room Realty: Portland market update, October 6, 2026
Metro median listing price near $588,000, down about 2% year over year, with active listings up roughly 7% (realtor.com data). Retrieved October 13, 2026.
- Real Estate Agent PDX: Portland market update, October 2026
RMLS-based tracker: nearly 47% of active listings with price decreases, below the 2025 peak of 51.6%; inventory tapering near its seasonal peak. Retrieved October 13, 2026.
- September 2026 Market Action Report, Portland Metro
RMLS-based August 2026 figures for the Portland metro: median sale price $540,000, down 1.8% year over year; 3.8 months of supply; about 57 days average market time. Retrieved October 13, 2026.
- Carver Home Team: Portland market update, homes taking longer to sell
September 2026 metro closed sales down 10.7% year over year. Retrieved October 13, 2026.
- Federal Reserve FOMC calendar
Next FOMC meeting October 27-28, 2026, with the rate decision on October 28; the final scheduled 2026 meeting is December 8-9. Retrieved October 13, 2026.
- CME FedWatch data (via Growbeansprout)
As of October 12, 2026, fed funds futures priced roughly an 80.5% probability of no change at the October 27-28 meeting, with the remainder assigned to a quarter-point hike. Retrieved October 13, 2026.
For the latest Portland metro market numbers, see our October 2026 market update, which carries the August RMLS-based figures, a median sale price of $540,000, 3.8 months of supply, and about 57 days of average market time, and has been revised to reflect this week's higher rate reading.
Ready to see your exact numbers?
Rates moved again this week, but your payment is a calculation, not a headline. Tell us the home you are eyeing and your down payment, and we will run today's payment math for your situation, then connect you with a lender we know and trust. Call (971) 777-3137, write to Concierge@pennergroupproperties.com, or send a note through the contact page.
For market notes, new listings, and local events as they happen, follow the team on Facebook.
Talk to the Team