
Rates & Market
Mortgage Rates Rise to 7.28%, the First Weekly Increase in Five Weeks
By Tim Penner · Penner Group Properties · November 20, 2026
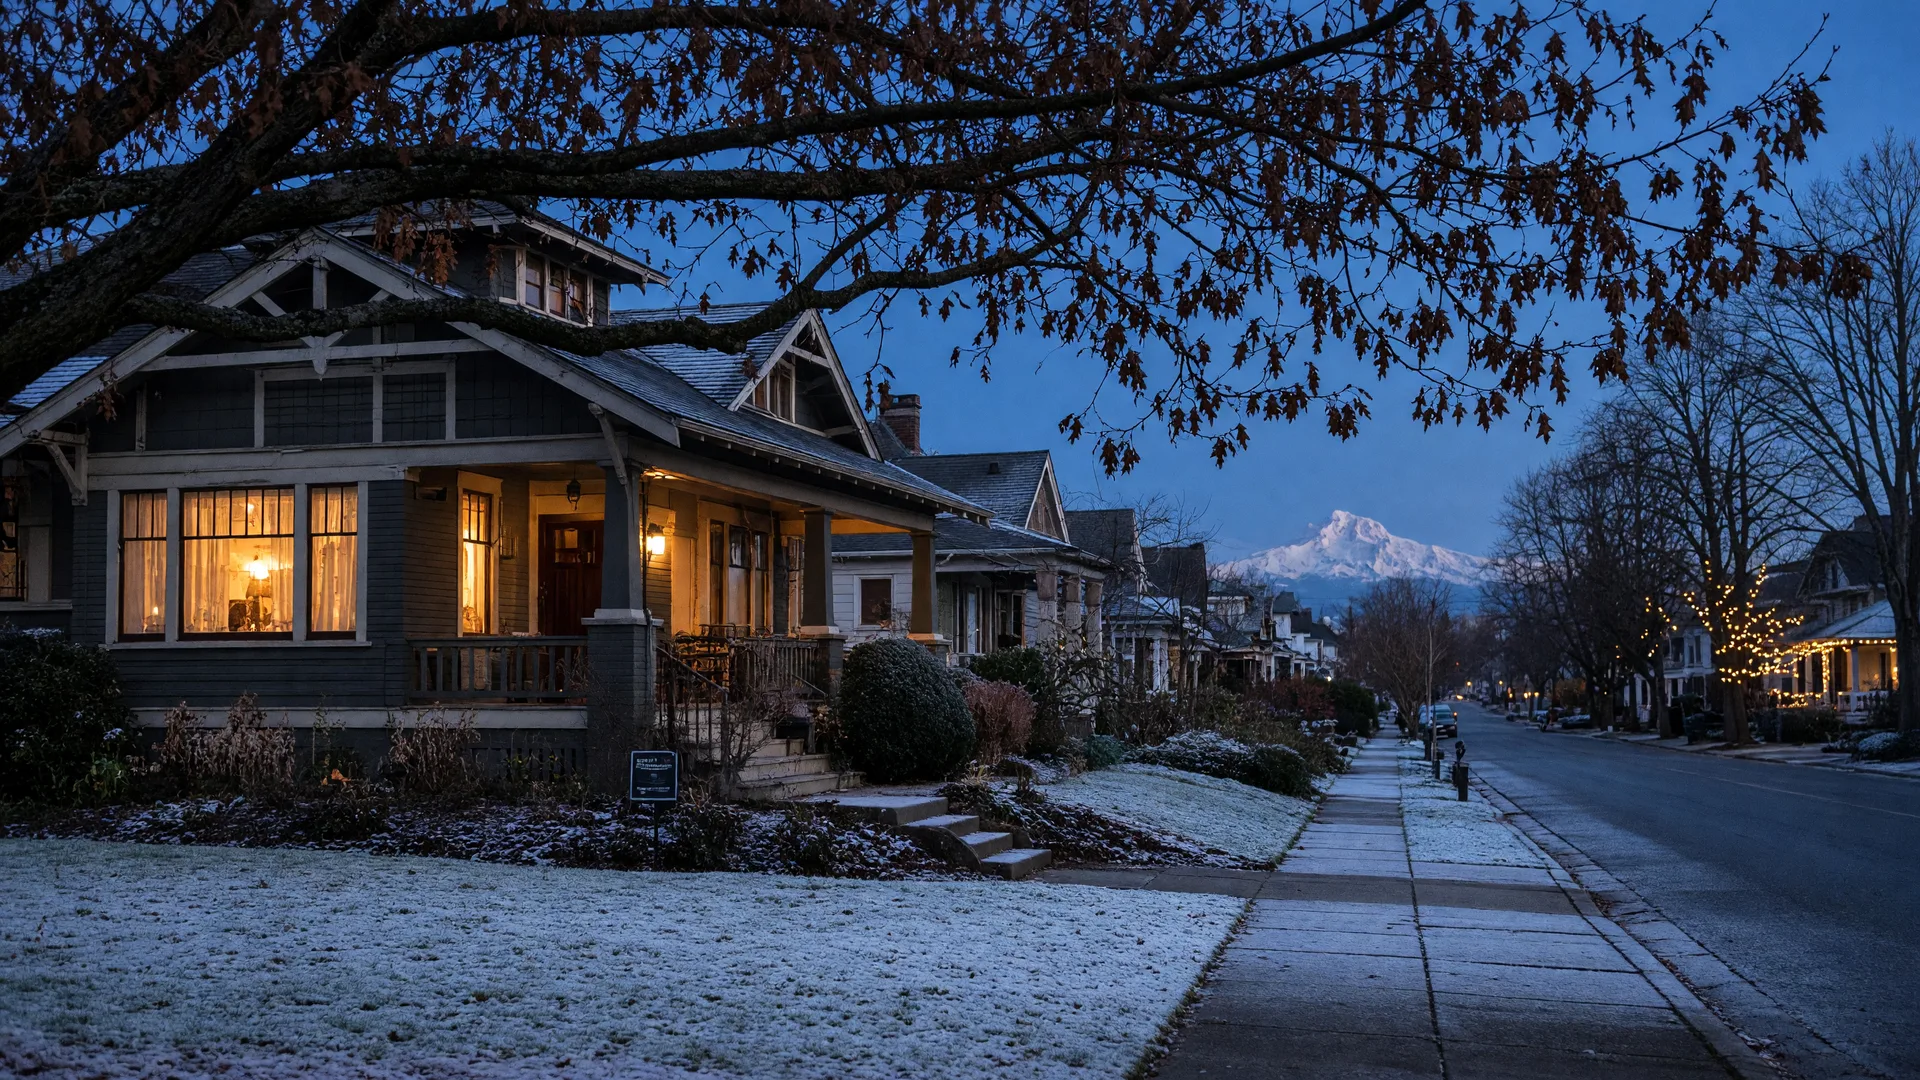
The Four-Week Rate Run Turns · Greater Portland, Oregon
Related Reading
The four-week rate run this note tracks began with the 7.40% three-year high of early October and the four straight weekly declines through the 7.11% low on November 12. Our October market report note covered the CPI-driven reversal in real time, and the note on the Fed holding rates explains what a December move would mean. For the forward view, see what the first 2027 forecasts say, also published today.
The Short Version
Freddie Mac's weekly survey put the average 30-year fixed mortgage at 7.28% for the week of November 19, 2026, up from 7.11% and the first increase in five weeks, ending the four-week run of declines and marking the ninth consecutive week above 7%. The 15-year fixed averaged 6.66%. The jump follows a hotter-than-expected inflation report that has kept the 10-year Treasury between roughly 5.05% and 5.12%, and it lands as the Fed's own minutes show nearly all officials expect a rate hike at the December 8-9 meeting, with futures pricing roughly a 95% chance of a quarter-point move. For the Portland metro, the October report still shows a $545,000 median, 4.3 months of supply, and closed sales down 21.5% year over year. The bottom line for planning: the four-week relief is over, a rate locked now still covers a December close, and the window before December 8-9 is where today's rate environment most likely holds.
7.28%
Average 30-year fixed mortgage, week of Nov 19
Freddie Mac PMMS; up from 7.11%; first increase in five weeks; 6.26% a year earlier
6.66%
Average 15-year fixed, week of Nov 19
Up from 6.45%; 5.54% a year earlier
$545,000
Median sale price, October 2026
Up 0.9% year over year; 4.3 months of supply
~95%
Market odds of a Fed hike Dec 8-9
CME FedWatch; October minutes: nearly all officials expect a move
The rate readings are Freddie Mac's weekly survey for the week of November 19, 2026, and the CME FedWatch December hike odds after the release of the October FOMC minutes; the price and supply figures are from the RMLS-based October 2026 report. See the sources at the bottom of this page.
The Survey, and the Week It Turned
For a month, the weekly survey and the daily market told different stories, the survey catching up only after rates had already moved. This week they finally agree. Four things explain what happened:
- The weekly survey finally caught up with the daily market. Freddie Mac's Primary Mortgage Market Survey printed 7.28% for the week of November 19, up 17 basis points from 7.11% and the first increase in five weeks, ending the four-week run of declines that had carried the average from 7.40% down to 7.11%. It was the largest one-week jump since the week of October 1 and the ninth consecutive week above 7%. The 15-year fixed averaged 6.66%, up from 6.45% and from 5.54% a year earlier. A year ago the 30-year averaged 6.26%.
- The driver was the bond market, not the meeting calendar. A hotter-than-expected October inflation report on November 10 had already ended the daily reprieve, and through the week the 10-year Treasury, the yield lenders price mortgages against, ran between roughly 5.05% and 5.12%, peaking near 5.12% on November 18 before easing slightly on Thursday. Daily 30-year purchase quotes climbed to about 7.40% midweek on the inflation jitters, then drifted back to near 7.23% by November 19. The official weekly number now reflects what buyers have actually been quoted for most of the month.
- The Fed's own minutes confirmed the direction of travel. The October 27-28 FOMC minutes, released Wednesday, November 18, showed nearly all officials expected a quarter-point rate hike at the December 8-9 meeting, with a vast majority worried that inflation would persist, and two policymakers floated the possibility of a half-point move. Governor Christopher Waller has publicly called for a 50-basis-point "shock" hike. CME FedWatch rate futures now price roughly a 95% chance of a quarter-point increase at the December 8-9 meeting, to a 4.00% to 4.25% target range, and about a two-in-three chance of another hike in January 2027. JPMorgan economists project three straight increases through March 2027, to 4.50% to 4.75%.
- Borrowers are beginning to respond to the climb. The Mortgage Bankers Association's survey for the week ending November 13 put the average 30-year contract rate at 7.35%, up from 7.21%, with the overall application index down 2.3% seasonally adjusted; purchase applications fell 3% for the week and sat roughly 18% below a year ago, while refinance applications ran about 54% below a year ago. Freddie Mac's chief economist, Sam Khater, used the jump to make the case for shopping: prospective buyers, he noted, "often shop around for a home" but do not always do the same for their mortgage, and comparing multiple rate quotes can save thousands over the life of the loan.
The short version for planning: the direction of travel has turned, the December meeting is the next hinge, and nothing in the minutes suggests rates fall before then. Our note on the first 2027 forecasts lays out where that path leads, and the winter market outlook covers how the season normally plays out from here.
What It Means for Buyers
For buyers, the relief week is over, and the practical question is whether a December close at today's rate makes sense for you. Three things worth doing this week:
- Rates just moved against you by about $55 a month. On a typical $436,000 loan (20% down on the $545,000 median), principal and interest run near $2,985 a month at the 7.28% reading, about $55 above the 7.11% survey a week earlier and roughly $300 above the same loan a year ago at 6.26%. Locks typically run 30 to 60 days, so a rate locked this week still covers a December close at today's number, before the Fed's December 8-9 meeting. Our note on the year-end buying window walks through the calendar town by town.
- The weekly survey is a lagging average; today's quote is what matters. The November 19 reading finally matches where daily quotes have been running, near 7.23% to 7.40%, and with the October minutes and a ~95% hike probability on the calendar, the next weekly readings are unlikely to fall. The practical play is unchanged: compare real lender quotes now, ask about temporary buydowns and seller-paid concessions, and check whether you qualify for Oregon's down payment programs, up to $60,000 of state help. Our note on down payment assistance walks through them, and the buying versus renting comparison frames the full monthly number, not just the mortgage line.
- The market still favors a patient buyer, even with rates up. October's report holds as the read of the year: a $545,000 median, up 0.9% year over year, with 4.3 months of supply, the most of the year, 67 days of average market time, and roughly half of active listings carrying price reductions. Buyers have choices, time, and room to negotiate inspections, contingencies, financing windows, and seller concessions. Our full read on the October report has the details, and the note on the market shifting toward buyers explains the mechanics.
A typical payment frames the math: a median-priced home around $545,000, purchased with 20% down and a 30-year fixed loan near 7.28%, brings a principal and interest payment of roughly $2,985 a month, before property taxes, insurance, and any HOA dues, about $55 above the same loan a week earlier and roughly $300 above a year ago. If you have read our buying versus renting comparison, you know the full monthly number is what matters, not the mortgage line alone.
What It Means for Sellers
For sellers, the rate turn is one more reason a holiday listing needs to be priced to this month's buyer, not last year's:
- Price against the buyer who is qualifying near 7.35%, because that is the contract rate now. A buyer who qualified at 6.26% a year ago carries roughly $300 more a month than this time last year, and the Fed's December 8-9 meeting, with a hike priced near certain, would push the payment higher still. Homes priced against current, closed comparables still draw showings in their first two weeks; homes priced against last year sit, and the data show they get cut.
- Thanksgiving is next week, and the holiday window is a real tactical choice. New listings thin out between Thanksgiving and New Year's, so a well-priced, well-presented listing competes against less, and the buyers who remain are pre-approved and often working toward a December 31 close. Our Thanksgiving week note walks through both windows for sellers, and the winter outlook covers the full November-through-January arc.
- Concessions and presentation close more deals than price cuts alone. With 4.3 months of supply and price reductions on roughly half of active listings, buyers compare carefully, and the home that shows at its best is the one that sells on its timeline. Contributing to a temporary buydown or covering a share of closing costs can turn a rate-conscious buyer into a contract, often for less than an equivalent price reduction. Our note on selling with a boutique team explains why process wins in a balanced market.
The honest version: October's numbers are the comps the market is actually transacting at, and they are flat. A home priced to those closed sales, presented well, and marketed with seller concessions in mind can still sell into the holiday lull, and our 10 decisions to make before listing covers the preparation either a holiday or a January listing requires.
What That Looks Like in Our Service Areas
The metro median is a useful starting place, but the value of a local team is the local picture. Here is how a rate climb into the holidays tends to play out around the communities we serve:
Beaverton & Sherwood
Washington County stays our most active territory, and it is where a rate climb lands first: typical prices near $530K in Beaverton and about $631K in Sherwood, with the strongest demand close to the MAX lines, the Tigard and Sherwood corridors, and well-regarded school districts. A $55-a-month swing between surveys and a $300-a-month gap versus a year ago matter most at these price points, which is why locking before December 8-9 is the live question there. See what homes cost in Beaverton and our Sherwood spotlight.
Hillsboro, Cornelius & Forest Grove
The technology corridor keeps household incomes and demand steady, and new construction in west Washington County frequently comes with lender incentives or builder buydowns that directly answer the rate environment, often available on a quick timeline for a year-end close. Typical prices near $548K in Hillsboro, $500K in Cornelius, and $485K in Forest Grove keep the math workable even near 7.3%. Our Hillsboro, Cornelius, and Forest Grove guides cover the local picture.
Newberg
Wine-country living keeps Newberg a steady blend of commuters and locals, with mid-$500K medians that keep the payment math workable even near 7.3%. The market is smaller and slower paced than the metro core, which suits sellers who price realistically into the holidays and buyers who want room to compare before the Fed meets. See our Newberg guide.
Wilsonville & Woodburn
Down I-5, the two ends of the payment spectrum: Wilsonville's typical home near $648K produces the largest monthly number in our service area, so its buyers feel this week's jump first, while Woodburn near $425K produces the smallest, which is why Woodburn keeps drawing first-time and move-up buyers even at 7.28%. Lower medians mean the same rate produces a smaller monthly swing, so the run-up stings least there. See living in Wilsonville and living in Woodburn.
Every one of these communities has its own rhythm, and the full map of our service areas shows the range we cover, from the metro core down the Willamette Valley. Our current listings show what is actually on the market right now, priced for this rate environment.
Sources
The figures in this update come from these public reports, retrieved November 20, 2026. Monthly payment figures are the team's own estimates from the prices and rates cited, and are not quotes.
- Freddie Mac News Release: Mortgage Rates Average 7.28%
Freddie Mac's Primary Mortgage Market Survey for the week of November 19, 2026: 30-year fixed at 7.28%, up from 7.11% and the first increase in five weeks; 15-year fixed at 6.66%, up from 6.45%. A year earlier the 30-year averaged 6.26% and the 15-year 5.54%. Chief economist Sam Khater urged borrowers to shop multiple rate quotes, which can save thousands over the life of a loan. Retrieved November 20, 2026.
- Freddie Mac Primary Mortgage Market Survey
Weekly national average mortgage rates, including the 7.28% reading for the week of November 19, 2026. Retrieved November 20, 2026.
- AP News: The average US 30-year mortgage rate rises to 7.28% this week, ending a four-week slide
Confirms the November 19 reading as the first increase in five weeks and the largest one-week jump since the week of October 1, 2026, with higher borrowing costs squeezing purchase power. Retrieved November 20, 2026.
- CNN Business: US mortgage rates rise for the first time in five weeks
Coverage of the November 19, 2026 Freddie Mac survey, attributing the jump to rising 10-year Treasury yields after a hotter-than-expected inflation report raised expectations of further Fed rate hikes. Retrieved November 20, 2026.
- Mortgage Professional America: Mortgage rates rise after four weeks of declines
The November 19 survey rise to 7.28% ended four straight weekly declines, the highest 30-year reading since October 22. Retrieved November 20, 2026.
- MBA Newsroom: Mortgage Applications Decrease in Latest MBA Weekly Survey
Mortgage Bankers Association weekly survey for the week ending November 13, 2026: Market Composite Index down 2.3% seasonally adjusted; average 30-year contract rate up to 7.35% from 7.21%; purchase applications down 3% week over week and about 18% year over year; refinance index down about 54% year over year. Retrieved November 20, 2026.
- AP via Northwest Arkansas Democrat-Gazette: Fed officials expect December rate hike
The October 27-28 FOMC minutes, released November 18, 2026, show nearly all officials expected a quarter-point rate hike at the December 8-9 meeting, a vast majority worried inflation would persist, and two policymakers floated a possible half-point move. Retrieved November 20, 2026.
- The McCreith Team: November 2026 Market Action Report, Portland metro
RMLS-based October 2026 figures: median sale price $545,000, up 0.9% year over year; 4.3 months of supply, the most of the year; 67 days of average market time; closed sales 1,622, down 21.5%; pending sales 1,587, down 20.2%. Retrieved November 20, 2026.
- Federal Reserve FOMC calendar
The FOMC's final scheduled meeting of 2026 is December 8-9, with rate futures pricing roughly a 95% chance of a quarter-point hike and about a two-in-three chance of another move in January 2027. Retrieved November 20, 2026.
Want the current rate and sales picture for your neighborhood?
We track pending and sold data across the Portland metro, Washington County, and the Willamette Valley all month long, and we run current lender quotes for clients every week. Call (971) 777-3137, write to Concierge@pennergroupproperties.com, or send a note through the contact page, and we will pull the recent sales and rate picture for your exact area, whether you are buying, selling, or just being curious at pennergroupproperties.com.
For market notes, new listings, and local events as they happen, follow the team on Facebook.
Talk to the Team