
Market Update
Portland's Market Is Shifting to Buyers: The Numbers, Explained
By Tim Penner · Penner Group Properties · October 27, 2026
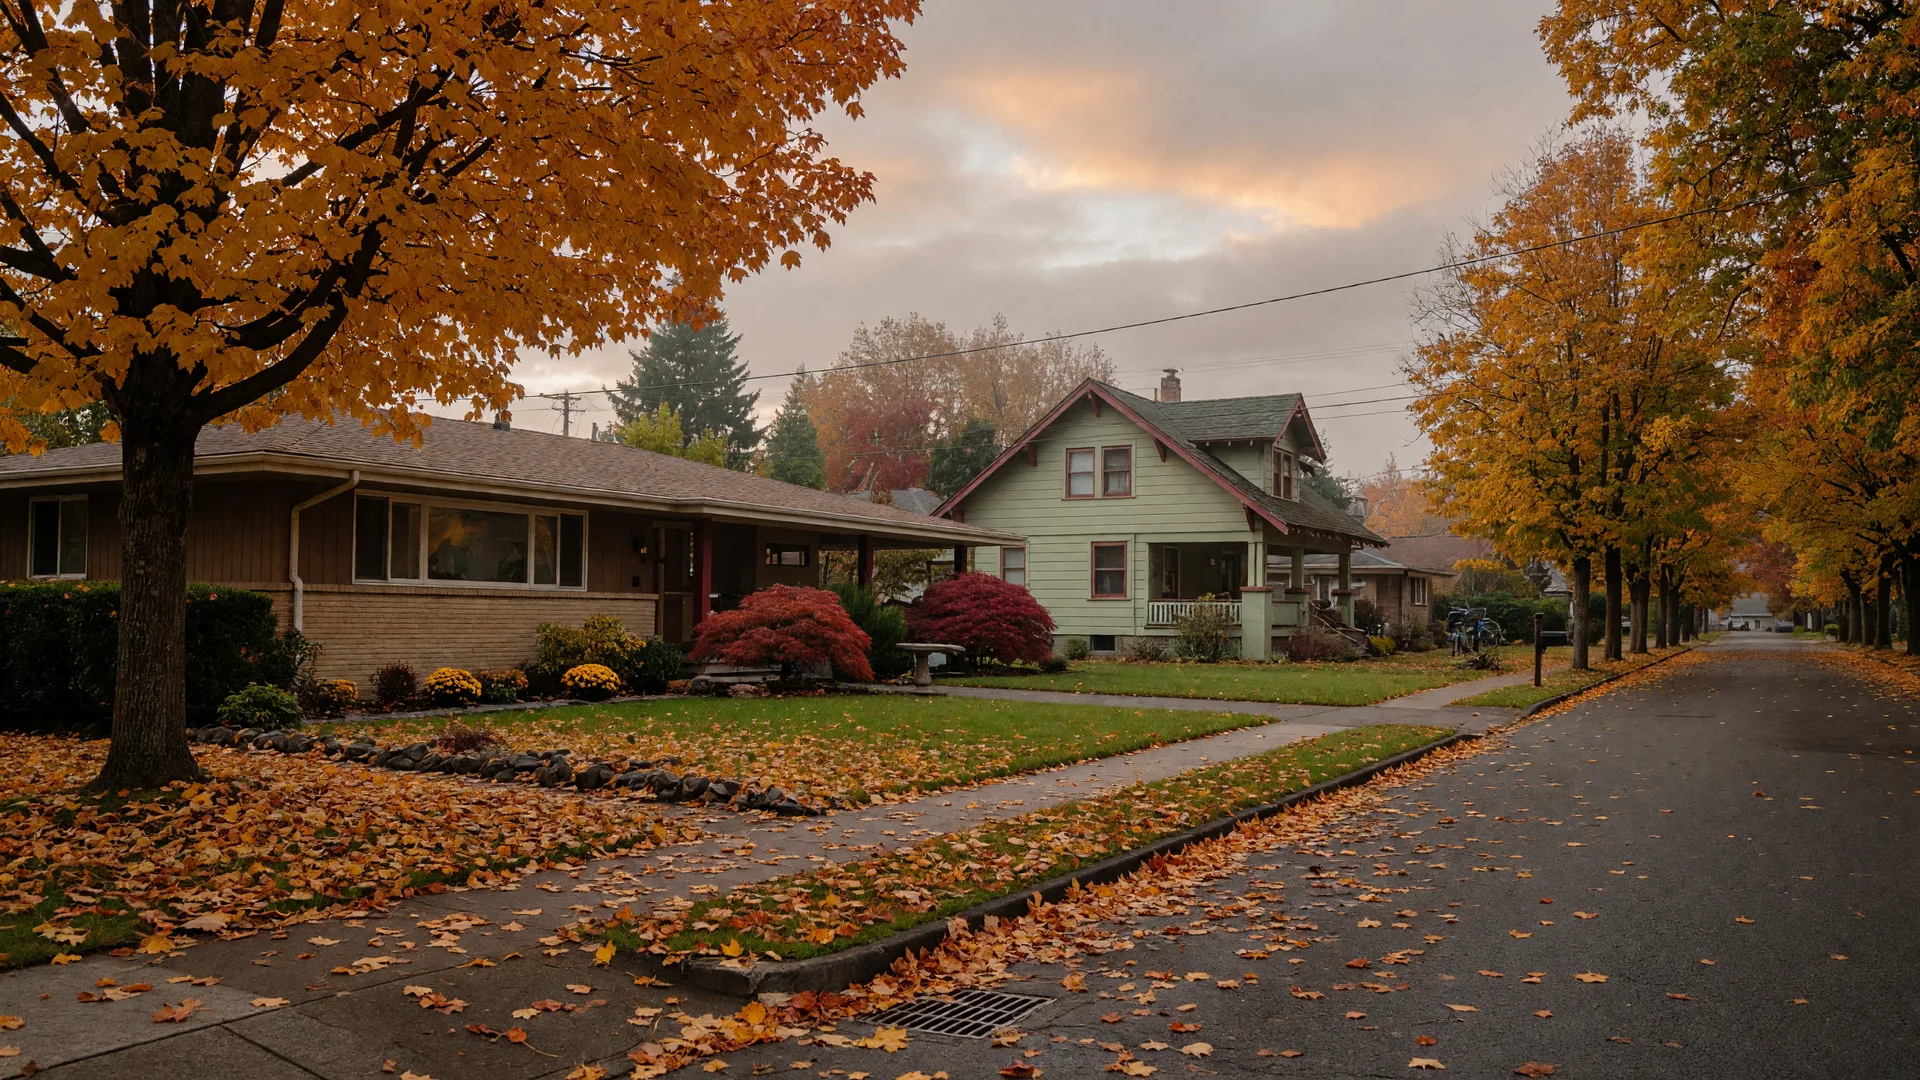
A Balanced Market, A Buyer-Friendly Fall · Greater Portland, Oregon
The Short Version
RMLS's full September report shows the Portland metro market has tipped toward buyers. Supply rose to 4.2 months, up from 3.8 in August, average market time stretched to 68 days from 57, and pending sales fell 12.6% month over month, all while the median sale price held flat at $545,000. Nearly half of active listings, 46.9%, carried a price reduction as of mid-September. The rates that drove the shift are not going anywhere fast: the 30-year mortgage averaged 7.32% for the week of October 22, its first decline after seven weeks of increases, and the Fed announces its next decision October 28 with a hold priced in. None of this means prices are falling, it means leverage has moved. Buyers now have time, choices, and negotiating room they have not had in years; sellers win with current pricing, concessions, and presentation. This note walks through the September numbers, what they change for buyers and sellers across our service areas, and what to expect into November.
$545,000
Portland metro median sale price, September 2026
Flat year over year; average sale price near $630,500
4.2 months
Months of supply, September 2026
Up from 3.8 in August as inventory nears its seasonal peak
68 days
Average market time, September 2026
Up from 57 days in August; homes take longer to sell
1,752
Closed sales, September 2026
Down 7.9% from August and 4.0% year over year
1,760
Pending sales, September 2026
Down 12.6% from August and 17.9% year over year
46.9%
of active listings carried a price reduction in mid-September
Up from 46.2% in mid-August, per RMLS Market Trends
RMLS-based Portland metro indicators for September 2026, supplemented by the RMLS Market Trends price-reduction snapshot and the Freddie Mac Primary Mortgage Market Survey reading for the week of October 22, 2026. See the sources at the bottom of this page.
How the Market Shifted
The shift did not happen in one month; it is the accumulation of a rate-driven 2026 settling into the fall data. Here is what the September report, released over the past week, actually shows:
- Supply crossed the four-month mark. September closed with about 4.2 months of supply, up from 3.8 in August. Agents and economists read the four-month line as the shift in leverage between sellers and buyers, and the movement is real: new listings ticked up while pending sales fell, and the combination pushed the cushion over that line. Active inventory is near its seasonal peak, which means choice, right now, is roughly as wide as it gets for the year.
- Contracts are forming more slowly. Pending sales fell to 1,760 in September, down 12.6% from August and 17.9% from a year earlier, and closed sales slipped to 1,752, down 7.9% from August. This is not a market where buyers have stopped looking; it is one where they are comparing more homes, negotiating terms, and waiting for the numbers to work. Slower formation is how a market rebalances after two years of rate shock.
- Pricing has started to bend. Nearly half of active metro listings, 46.9%, carried a price reduction as of mid-September, up from 46.2% a month earlier, according to the RMLS Market Trends snapshot. Realtor.com counts the same pressure differently: 31.6% of Portland listings had a price cut during September, versus 20.8% nationally. Two measures, one direction: list prices increasingly have room to move.
- Rates are the engine, and they are not easing fast. The average 30-year fixed mortgage was 7.32% for the week of October 22, the first weekly decline since late August but still near a three-year high. The Fed announces its next decision October 28 with a hold already priced in, and Fannie Mae's mid-October forecast expects the 30-year to average about 7.4% in the fourth quarter of 2026 and about 7.5% through 2027. Nothing in the rate picture points to a quick return of the 2020-2021 market.
- The city is a different market from the suburbs. The metro average hides a split. In the city of Portland, Redfin's three-month median ran near $518,000 with homes selling in about 25 days, while the suburbs and the Willamette Valley carry most of the longer market times and deeper price flexibility. Where you look changes what the market feels like, which is exactly why a local team still matters.
What It Means for Buyers
Leverage is the word for this market, and leverage only helps if you use it. Here is how:
- You have time now, so use it deliberately. Inspection windows, financing contingencies, and real due-diligence periods are back in contracts across many neighborhoods, terms that were hard to win in the last seller's market. Tour a range of homes, compare three to five properties you could actually buy, and let the price reductions on the market do some of your negotiating for you before you write an offer.
- A price reduction is an invitation, not a floor. The nearly half of active listings carrying a reduction have already told you their owner is motivated. Study the date of the price change, not just the new number: a fresh cut from an owner who has sat through October is a stronger signal than a stale one from August. Pair that with a realistic comp and you have the shape of a good offer.
- Use the payment tools that work in this environment. Seller concessions toward closing costs or a temporary buydown are being asked for and granted, and Oregon's down payment programs offer up to $60,000 in help for eligible buyers. Our <a href="/blog/oregon-down-payment-assistance-2026/" class="underline decoration-[#B6903F]/60 underline-offset-2 hover:text-[#6B1F2B]">note on Oregon down payment assistance</a> walks through the state programs, and the <a href="/blog/first-time-buyers-portland-metro/" class="underline decoration-[#B6903F]/60 underline-offset-2 hover:text-[#6B1F2B]">first-time buyer checklist</a> covers the order in which to do everything else.
- Get pre-approved before you fall in love. On a median-priced home with 20% down, the loan is about $432,000, and at 7.32% the principal and interest payment runs near $2,967 a month before taxes and insurance. A pre-approval tells you your actual number, locks today's rate for a set window, and lets you move the day a well-priced home hits the market, because even in a buyer-lean market the best homes still go quickly.
If you would like a run of the current rates for your situation, a read on your target neighborhood's recent sales, or a referral to a lender we trust, ask us. That is part of the job we do every week, and it costs nothing to start the conversation. Call (971) 777-3137 or send a note through the contact page.
What It Means for Sellers
For sellers, the buyer-friendly shift does not mean your home cannot sell; it means the rules changed:
- Price against September's closed sales, not June's. With average market time at 68 days and nearly half of active listings carrying price reductions, the market is already signaling price fatigue. Homes priced against current, closed comparables still draw showings in the first two weeks; homes priced to last summer's comps sit, then cut, and often sell for less than a sharp opening price.
- Concessions and buydowns now outsell price cuts. Contributing to a temporary buydown or paying a share of closing costs can turn a rate-conscious buyer into a contract, often for less than an equivalent price reduction and with more value per dollar. Buyers at 7.3% mortgages are asking for this; a listing that answers the rate question in its marketing stands out.
- Your first two weeks are your whole campaign. Buyers have more inventory and more patience, and a listing that lingers gets read as stale. The homes that win in this market are the ones that are priced, staged, photographed, and marketed at their best from day one. Our <a href="/blog/sellers-guide-10-decisions-before-listing/" class="underline decoration-[#B6903F]/60 underline-offset-2 hover:text-[#6B1F2B]">seller's guide to the 10 decisions before listing</a> and the note on <a href="/blog/selling-with-a-boutique-team/" class="underline decoration-[#B6903F]/60 underline-offset-2 hover:text-[#6B1F2B]">selling with a boutique team</a> cover the full sequence.
- A November listing still makes sense. Inventory dips after Thanksgiving and the buyers who remain are serious, and the tax-motivated and relocation buyers of November and December are often in a position to move quickly. The window between the Fed's October 28 decision and the holidays can be a sweet spot for a well-priced home, a point we made in our <a href="/blog/portland-winter-market-outlook-2026/" class="underline decoration-[#B6903F]/60 underline-offset-2 hover:text-[#6B1F2B]">winter market outlook</a>.
What This Looks Like Across Our Service Areas
The metro median is a useful starting place, but the value of a local team is the local picture. Here is how the buyer-friendly shift tends to play out around the communities we serve (the pattern, not the exact number for a specific street, which you should always verify):
Beaverton and Hillsboro: the two largest pieces of our Washington County market, with typical prices near $530K and $548K and the strongest demand close to the MAX lines, the technology corridor, and well-regarded school districts. They are also where the buyer-lean shift is most visible at the listing level: homes here draw a solid first week, then slow sharply if priced above current comps. Their guides, <a href="/blog/beaverton-home-costs/" class="underline decoration-[#B6903F]/60 underline-offset-2 hover:text-[#6B1F2B]">what homes actually cost in Beaverton</a> and <a href="/blog/living-in-hillsboro/" class="underline decoration-[#B6903F]/60 underline-offset-2 hover:text-[#6B1F2B]">living in Hillsboro</a>, go neighborhood by neighborhood.
Cornelius and Forest Grove: the most affordable corners of the Portland westside, with typical sold prices near $500K and $485K. Lower medians mean the same rate produces a smaller monthly swing, and both towns show the metro's pattern in miniature: more choices, longer market times, more room to negotiate. See our <a href="/blog/living-in-cornelius/" class="underline decoration-[#B6903F]/60 underline-offset-2 hover:text-[#6B1F2B]">Cornelius</a> and <a href="/blog/living-in-forest-grove/" class="underline decoration-[#B6903F]/60 underline-offset-2 hover:text-[#6B1F2B]">Forest Grove</a> spotlights.
Sherwood and Newberg: two slower-paced markets where the shift is gentler. Sherwood's typical price near $631K reflects Old Town charm and a top-rated district, and well-priced homes there still move in weeks, while Newberg's mid-$500K medians keep wine-country living within reach with a longer, calmer selling season. Our <a href="/blog/living-in-sherwood/" class="underline decoration-[#B6903F]/60 underline-offset-2 hover:text-[#6B1F2B]">Sherwood</a> and <a href="/blog/living-in-newberg/" class="underline decoration-[#B6903F]/60 underline-offset-2 hover:text-[#6B1F2B]">Newberg</a> guides cover both.
Wilsonville and Woodburn: the two ends of the I-5 corridor and the two ends of the payment spectrum. Wilsonville's typical price near $648K produces the largest monthly number in our service area, which is exactly why its listings feel the rate pressure first, while Woodburn near $425K keeps the smallest, which is why it keeps drawing first-time and move-up buyers even as the market cools. See <a href="/blog/living-in-wilsonville/" class="underline decoration-[#B6903F]/60 underline-offset-2 hover:text-[#6B1F2B]">living in Wilsonville</a> and <a href="/blog/living-in-woodburn/" class="underline decoration-[#B6903F]/60 underline-offset-2 hover:text-[#6B1F2B]">living in Woodburn</a>.
Every one of these communities has its own rhythm, and the full map of our service areas shows the range we cover, from the metro core to the Willamette Valley. Our current listings show what is actually on the market right now, priced for this rate environment. For the town-by-town payment math at the latest rates, see our payment-by-community note, and for the broader October picture, the October market update.
Sources
The figures in this note come from these public reports, retrieved October 27, 2026:
- Freddie Mac Primary Mortgage Market Survey
Weekly national average mortgage rates: 30-year fixed at 7.32% for the week of October 22, 2026, down from 7.40% and the first weekly decline since late August; 15-year fixed at 6.68%. Retrieved October 27, 2026.
- PropertyBlotter: Portland Area + LO ~ Sept 2026 Market Stats
RMLS-based September 2026 average market time of 68 days for the greater Portland area, up 11 days from August's 57. Published October 25, 2026; retrieved October 27, 2026.
- Cano Real Estate: Portland Metro Real Estate Market Report
RMLS-based September 2026 figures for the Portland metro: median sale price $545,000, flat year over year; average sale price near $630,500; about 4.2 months of supply, up from 3.8 in August; 1,752 closed sales, down 7.9% month over month and 4.0% year over year; 2,487 new listings; 1,760 pending sales, down 12.6% month over month and 17.9% year over year. Retrieved October 27, 2026.
- Real Estate Agent PDX: Portland Real Estate Market Update, October 2026
46.87% of active Portland metro listings carried a price reduction as of September 18, 2026, up from 46.18% in mid-August and 43.20% in mid-July, per the RMLS Market Trends snapshot. Retrieved October 27, 2026.
- Realtor.com September Housing Report: Price cuts reach yearly high
31.6% of Portland metro listings carried a price reduction in September 2026, versus 20.8% nationally. Retrieved October 27, 2026.
- Redfin: 2026 Portland Housing Market
City of Portland three-month median sale price near $518,000, down about 2% year over year, with homes selling in about 25 days. Retrieved October 27, 2026.
- CNBC: Fannie Mae sharply raises mortgage rate forecast for 2027
Fannie Mae's October 14, 2026 forecast projects the 30-year averaging about 7.4% in the fourth quarter of 2026 and about 7.5% through 2027. Retrieved October 27, 2026.
- Federal Reserve FOMC calendar
FOMC meeting October 27-28, 2026, with the rate decision announced October 28 at 2:00 p.m. ET; the final scheduled 2026 meeting is December 8-9. Retrieved October 27, 2026.
- FedRateCalc: Next Fed Meeting Countdown
Market pricing ahead of the October 27-28 meeting reflected roughly a 90% probability that the FOMC holds its target range at 3.75% to 4.00%. Retrieved October 27, 2026.
Want this level of detail for your neighborhood?
We track pending and sold data across the Portland metro, Washington County, and the Willamette Valley all month long. Call (971) 777-3137, write to Concierge@pennergroupproperties.com, or send a note through the contact page, and we will pull the recent sales for your exact area, whether you are buying, selling, or just being curious at pennergroupproperties.com.
For market notes, new listings, and local events as they happen, follow the team on Facebook.
Talk to the Team