
Rates & Market
What a 7.40% Mortgage Rate Means for Your Monthly Payment, Community by Community
By Geri and Tim Penner · Penner Group Properties · October 22, 2026
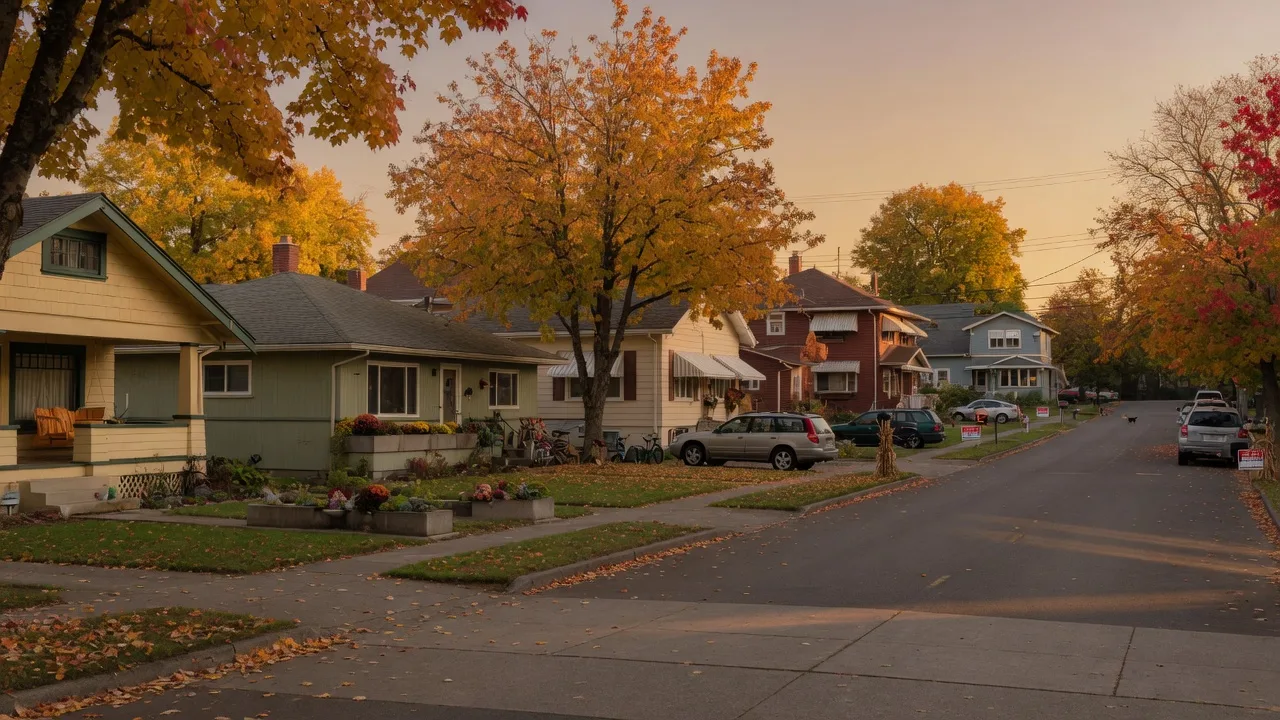
The Same Rate, Eight Different Monthly Numbers · Greater Portland, Oregon
Revised October 27, 2026
RMLS's full September report also put average market time at 68 days, up from 57 in August, with about 46.9% of active listings carrying a price reduction as of mid-September (RMLS Market Trends), another sign the market has moved toward buyers. The town-by-town payment ranking below is unchanged. Our note on the market shifting to buyers, published October 27, 2026, walks through the full September picture.
Revised October 23, 2026
The rate table below was built on the 7.40% average of the week of October 15. Freddie Mac's next reading put the 30-year fixed at 7.32% for the week of October 22, the first weekly decline since late August, which trims roughly $25 a month from each payment in the table. The town-by-town comparison still holds, and the spread between the most and least expensive communities is unchanged in shape. For the updated figures, see our note on rates easing to 7.32%, published October 23, 2026.
The Short Version
The average 30-year fixed mortgage sits at 7.40% for the week of October 15, 2026, near a three-year high and up from 6.27% a year earlier. On a median-priced Portland metro home of $545,000 bought with 20% down, principal and interest run about $3,020 a month. But the metro median tells only part of the story: the same 7.40% rate produces a payment of about $2,355 on Woodburn's typical home and roughly $3,590 on Wilsonville's, a spread of about $1,235 a month across the communities we serve. Here is the payment math, town by town, and what buyers and sellers can do with it.
7.40%
Average 30-year fixed mortgage, week of October 15, 2026
Freddie Mac PMMS, unchanged week over week; up from 6.27% a year earlier
~$6.92
Monthly principal and interest per $1,000 borrowed at 7.40%
Every $10,000 of loan adds roughly $69 a month, before taxes, insurance, and HOA
$545,000
Portland metro median sale price, September 2026
Flat year over year; about 4.2 months of supply, 68 days on market (final figures)
~$1,235
Monthly payment gap across our service areas, same 20% down
Wilsonville's typical home costs about $1,235 a month more to finance than Woodburn's
The rate is the Freddie Mac Primary Mortgage Market Survey reading for the week of October 15, 2026; the metro figure is the RMLS-based September 2026 Portland metro median; the town spread uses the typical prices below. See the sources at the bottom of this page.
The Payment, Community by Community
The table below is the honest answer to the question clients ask most right now: what does this rate actually do to my monthly number? It uses each community's typical sold price from our 2026 neighborhood guides, 20% down, and the 7.40% average, and shows the principal and interest before property taxes, insurance, and any HOA dues.
| Community | Typical sold price | 20% down | Loan | P&I at 7.40% |
|---|---|---|---|---|
| Woodburn guide | ~$425K | ~$85K | ~$340K | $2,355 /mo |
| Forest Grove guide | ~$485K | ~$97K | ~$388K | $2,685 /mo |
| Cornelius guide | ~$500K | ~$100K | ~$400K | $2,770 /mo |
| Newberg guide | ~$515K | ~$103K | ~$412K | $2,850 /mo |
| Beaverton guide | ~$530K | ~$106K | ~$424K | $2,935 /mo |
| Hillsboro guide | ~$548K | ~$110K | ~$438K | $3,035 /mo |
| Sherwood guide | ~$631K | ~$126K | ~$505K | $3,495 /mo |
| Wilsonville guide | ~$648K | ~$130K | ~$518K | $3,590 /mo |
| Portland metro (reference) | $545,000 | $109,000 | $436,000 | $3,020 /mo |
At the 7.40% average with 20% down, monthly principal and interest per town. Figures are rounded estimates based on typical sold prices, before property taxes, insurance, and any HOA dues; they are not quotes, and the exact street, lot, and home matter far more than the town average.
What the Year's Rate Climb Does to a Payment
A year ago the average 30-year fixed mortgage was 6.27%. At today's 7.40%, the same loan costs meaningfully more, and the size of the difference scales with the size of the loan:
- On a median-priced metro home, the $436,000 loan runs about $3,020 a month at 7.40%, versus about $2,690 at 6.27%. That is roughly $330 more a month, about $3,960 more over a year, with nothing else about the home changed.
- On Woodburn's typical home, the $340,000 loan runs about $2,355 at 7.40%, versus about $2,100 at 6.27%, roughly $255 more a month. The same rate produces a smaller dollar swing in a lower-priced market.
- On Wilsonville's typical home, the $518,000 loan runs about $3,590 at 7.40%, versus about $3,195 at 6.27%, roughly $395 more a month. Larger loans carry larger swings, which is part of why buyer demand in higher-priced towns has softened first.
That year-over-year comparison matters because sellers are pricing against it. A buyer who qualified a year ago now carries a meaningfully higher payment on the same home, so the honest conversation is about the full monthly number, not the list price. Our note on rates at 7.40% and buying versus renting comparison both walk through the full cost picture.
How Buyers Can Make the Numbers Work
A 7.40% rate is not the end of the homebuying conversation, but it does change the tactics. Here is what we tell buyers in our area:
- Get pre-approved and lock when the number works, not when the news feels right. A pre-approval pins down today's rate for a set window, which matters in a market where rates have climbed for weeks, and it lets you move the moment the right home lists.
- Ask about seller concessions and temporary buydowns. In a balanced market where roughly a third of metro listings carry price reductions, sellers routinely contribute toward closing costs or a temporary buydown. A 2-1 buydown can shave meaningful dollars off the first two years of a payment, often for less than an equivalent price cut.
- Look at Oregon's down payment help before you assume you need 20%. Oregon offers up to $60,000 in down payment assistance through OHCS and related programs, and a smaller down payment can get you into a home now rather than waiting years to save a larger one. We cover the programs in detail in our <a href="/blog/oregon-down-payment-assistance-2026/" class="underline decoration-[#B6903F]/60 underline-offset-2 hover:text-[#6B1F2B]">note on Oregon down payment assistance</a>.
- Let the town spread work for you. The same rate, the same 20% down, produces a roughly $1,235-a-month swing between Woodburn and Wilsonville. If the payment is the constraint, a move within our service area can buy square footage without stretching the budget. That is a conversation worth having early, before touring.
The takeaway: the rate environment is real, but it is also negotiable around the edges. A buyer who comes in pre-approved, understands the tools, and keeps an open mind about community is in a stronger position than one who waits for a rate headline to change.
What Sellers Should Know
Sellers feel the same rate in a different way: their buyer pool is carrying bigger payments. That argues for four things:
- Price against the financing your buyers actually face. A buyer who qualified at 6.27% a year ago now carries roughly $330 more a month on a median-priced metro loan. Homes priced against current, closed comparables still draw showings in the first two weeks; homes priced a year ago sit.
- Seller concessions are a real tool, and buyers are asking. Contributing to a temporary buydown or paying a share of closing costs can turn a rate-shocked buyer into a contract, often for less than a price cut and with more value per dollar.
- Days on market still matter. With the metro averaging 68 days, a listing that lingers gets read as stale. A sharp first-week pricing strategy keeps you ahead of that cycle.
- Presentation separates listings. In a market where buyers have choices, the home that shows at its best, clean, staged, photographed well, and marketed with intent is the one that sells on its timeline. Our <a href="/blog/selling-with-a-boutique-team/" class="underline decoration-[#B6903F]/60 underline-offset-2 hover:text-[#6B1F2B]">note on selling with a boutique team</a> explains why process and presentation win in a balanced market.
Why the Local Picture Matters
A metro median is a useful starting place, but the value of a local team is the local picture. Here is how the same 7.40% rate tends to play out around the communities we serve, and where to dig deeper:
Beaverton and Hillsboro: the two largest pieces of our Washington County market, with typical prices near $530K and $548K respectively and the strongest demand close to the MAX lines, the technology corridor, and well-regarded school districts. Their guides, <a href="/blog/beaverton-home-costs/" class="underline decoration-[#B6903F]/60 underline-offset-2 hover:text-[#6B1F2B]">what homes actually cost in Beaverton</a> and <a href="/blog/living-in-hillsboro/" class="underline decoration-[#B6903F]/60 underline-offset-2 hover:text-[#6B1F2B]">living in Hillsboro</a>, go neighborhood by neighborhood.
Cornelius and Forest Grove: the most affordable corners of the Portland westside, with typical sold prices near $500K and $485K. They are the entry points for buyers who want Washington County without the Washington County price tag, and the payment math at 7.40% shows exactly why. See our <a href="/blog/living-in-cornelius/" class="underline decoration-[#B6903F]/60 underline-offset-2 hover:text-[#6B1F2B]">Cornelius</a> and <a href="/blog/living-in-forest-grove/" class="underline decoration-[#B6903F]/60 underline-offset-2 hover:text-[#6B1F2B]">Forest Grove</a> spotlights.
Sherwood and Newberg: two slower-paced markets where the rate math lands in the middle. Sherwood's typical price near $631K reflects Old Town charm and a top-rated district, while Newberg's mid-$500K medians keep wine-country living within reach. Our <a href="/blog/living-in-sherwood/" class="underline decoration-[#B6903F]/60 underline-offset-2 hover:text-[#6B1F2B]">Sherwood</a> and <a href="/blog/living-in-newberg/" class="underline decoration-[#B6903F]/60 underline-offset-2 hover:text-[#6B1F2B]">Newberg</a> guides cover both.
Wilsonville and Woodburn: the two ends of the I-5 corridor, and the two ends of the payment spectrum. Wilsonville's typical price near $648K produces the largest monthly number in our service area, while Woodburn near $425K produces the smallest, which is why Woodburn keeps drawing first-time and move-up buyers. See <a href="/blog/living-in-wilsonville/" class="underline decoration-[#B6903F]/60 underline-offset-2 hover:text-[#6B1F2B]">living in Wilsonville</a> and <a href="/blog/living-in-woodburn/" class="underline decoration-[#B6903F]/60 underline-offset-2 hover:text-[#6B1F2B]">living in Woodburn</a>.
Every one of these communities has its own rhythm, and the full map of our service areas shows the range we cover. Our current listings show what is actually on the market right now, priced for this rate environment.
Sources
The figures in this note come from these public reports, retrieved October 22, 2026. Monthly payment figures are our own estimates from those prices and the Freddie Mac rate.
- Freddie Mac Primary Mortgage Market Survey
Weekly national average mortgage rates: 30-year fixed at 7.40% for the week of October 15, 2026, unchanged week over week and up from 6.27% a year earlier. Retrieved October 22, 2026.
- Cano Real Estate: Portland Metro Real Estate Market Report
RMLS-based September 2026 figures for the Portland metro: median sale price $545,000, flat year over year; about 4.2 months of supply; 68 days of average market time, up from 57 in August (final September figure). Retrieved October 22, 2026.
- Redfin: Cornelius Housing Market
Cornelius typical sold price near $500,000, down about 5% year over year. Retrieved October 22, 2026.
- Redfin: Forest Grove Housing Market
Forest Grove typical sold price near $485,000 for mid-2026, the most affordable on the Portland westside corridor. Retrieved October 22, 2026.
- Redfin: Hillsboro Housing Market
Hillsboro three-month median sale price near $548,000. Retrieved October 22, 2026.
- Redfin: Sherwood Housing Market
Sherwood three-month median sale price near $631,000, up about 1.8% year over year. Retrieved October 22, 2026.
- Redfin: Newberg Housing Market
Newberg median sale price in the low-to-mid $500Ks through 2026. Retrieved October 22, 2026.
- Redfin: Woodburn Housing Market
Woodburn typical home price near $425,000, the most affordable entry point in our service area. Retrieved October 22, 2026.
- Zillow: Wilsonville Home Values
Wilsonville median home value near $648,000, the highest typical figure in our service area. Retrieved October 22, 2026.
- Freddie Mac: Mortgage Rates Hold Steady at 7.40%
Freddie Mac news release confirming the 7.40% average for the week of October 15, 2026, and the 6.27% reading a year earlier. Retrieved October 22, 2026.
Want the real number for your situation?
The table above is a town average, and your payment depends on your exact home, loan terms, and taxes. We run these numbers with clients every week across the Portland metro, Washington County, and the Willamette Valley. Call (971) 777-3137, write to Concierge@pennergroupproperties.com, or send a note through the contact page, and we will walk through the rates, the payments, and your plan, whether you are buying, selling, or just being curious at pennergroupproperties.com.
For market notes, new listings, and local events as they happen, follow the team on Facebook.
Talk to the Team